One of the most powerful information radiators for a Scrum Team, the Sprint Burndown chart provides insight into how the team works and helps predict the likelihood of completing their sprint goal. The Sprint Burndown chart shows the amount of work that has been completed in a sprint and the total work remaining. They’re also great for keeping the team aware of any scope creep that occurs. Jira provides great built-in Sprint Burndown charts that we’ll explore in the examples below and identify the warning signs they can help provide.
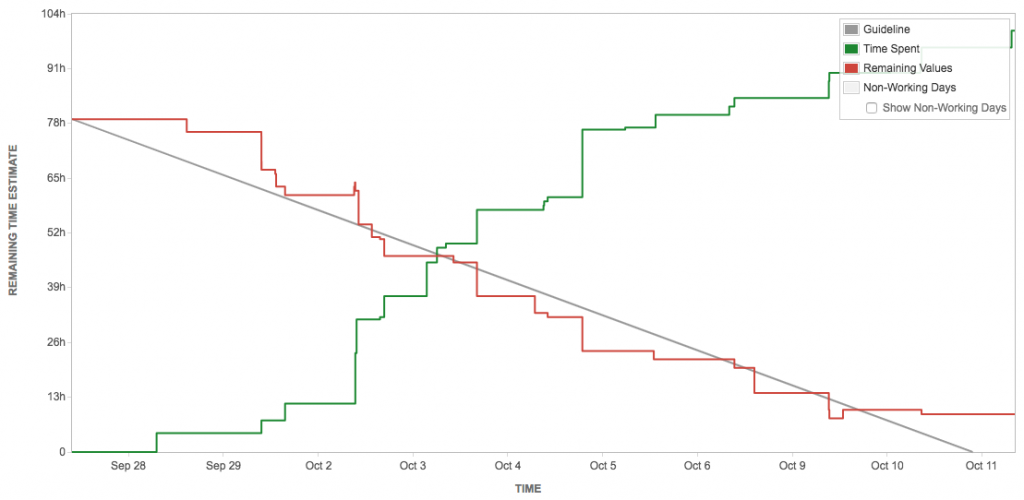
Sprint Burndown – On Track
In the below example you’ll see the remaining time estimate burndown (red line) stair step down closely along the grey guideline which indicates the team was on track until the last day of the sprint.
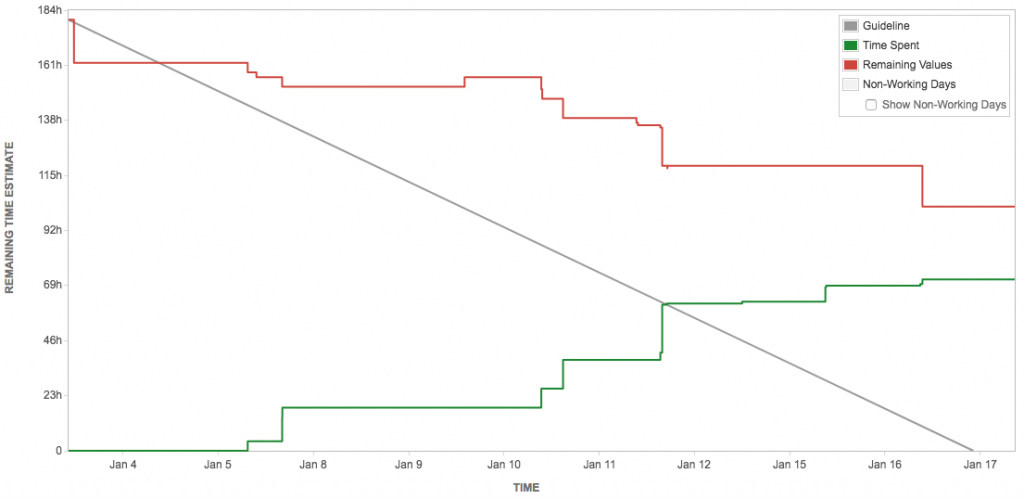
Sprint Burndown – Off Track
In the below example you’ll see the remaining hours burndown (red line) well above the grey guideline which indicates the team was off track the majority of this sprint.
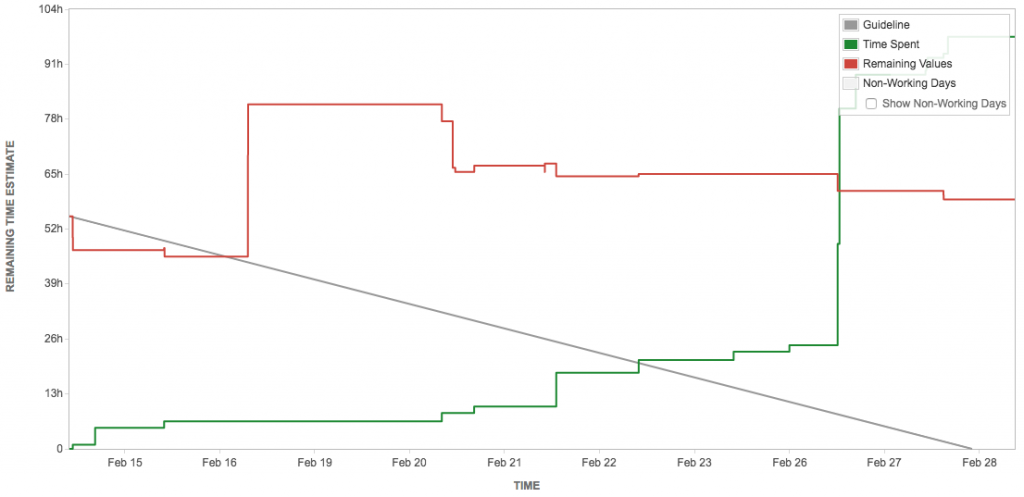
Sprint Burndown – Scope Increase
In the below example you’ll see the remaining time estimate jump up 50% just 2 days into the sprint indicating an increase in scope (which could be due to added requirements or the team discovering the original work was underestimated).